Air quality in Medellín: a scoping exercise
In our quest to locate a suitable place in Medellín where air pollution levels are within reasonable levels, it seems like a good idea to obtain data. This made me dive deeper into the topic of air quality measurement. Turns out, there is quite a lot to it!
First of all, let's have a look at some guidelines around air pollution. Particulate matter is our main concern. The WHO Air quality guideline values for particulate matter are as follows:
Fine particulate matter (PM2.5)
- 10 μg/m3 annual mean
- 25 μg/m3 24-hour mean
Coarse particulate matter (PM10)
- 20 μg/m3 annual mean
- 50 μg/m3 24-hour mean
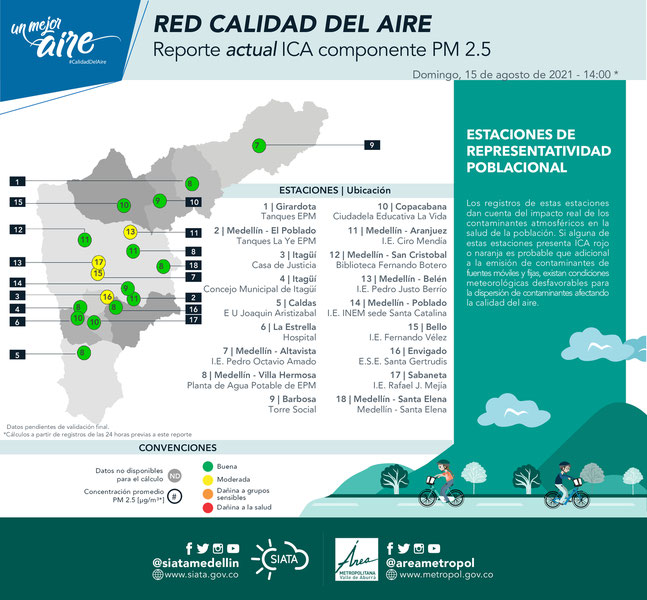
The "Un Mejor Aire" website from the Metropolitan Area of the Aburrá Valley presents a chart with the current PM2.5 values. At the moment, most stations report at somewhat decent levels. However, we just had a number of rainy days, and this is furthermore the time of the year with the best air quality. So, with most stations at best hovering around the top of the recommended guidelines, and some above, this is already troublesome.

What complicates matters, is that the air quality levels seem to vary quite strongly between different measuring stations. Within a 5 km radius, PM2.5 values go from 8 to 17 μg/m3. This is no doubt related to a rather complex set of factors, including human activity as well as topographical and climatological influences. However, this means that relying on the handful of measurement stations and selecting a location roughly in the same area could misguide our decision making process.
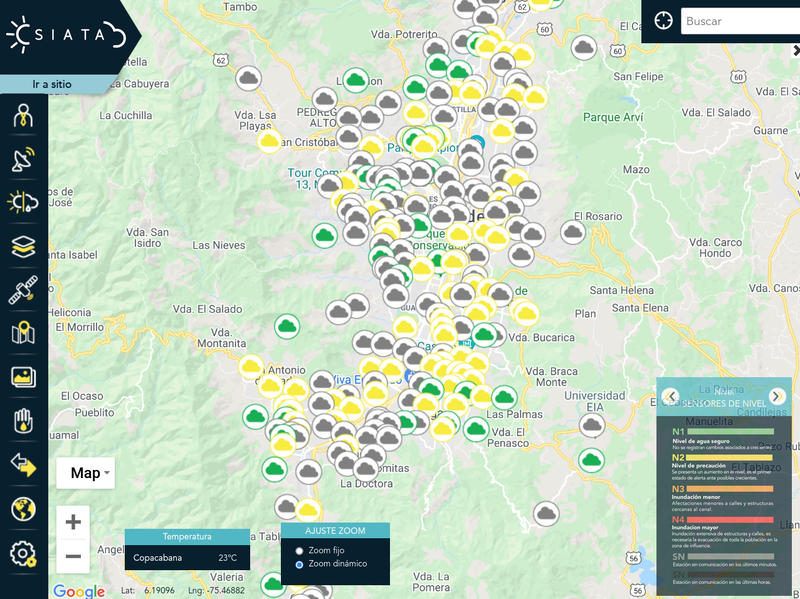
After some additional digging, it turns out that SIATA set up a network of citizen scientists a few years ago. Each of the participants was equipped with a measuring device, which was installed at their home. This led to a network of 400 devices (called "nubes" - clouds) spread across the city. Interesting! Each device measures temperature, humidity, and PM2.5. As can be seen in the map below, there is a much wider coverage and this allows for a much more nuanced understanding of PM2.5 values within different areas.
Unfortunately, a large share of these devices are no longer active. Still, many of them do remain operational and this provides much better coverage than the official city measurement stations. There is likely a price to be paid around accuracy, but I am hoping that we can more reliably pick up patterns due to the large number of devices.
Now... how to get some actual data? The interactive map from SIATA provides a historic record and graphs for each of the measurement stations and the cloud devices. In the regular map view, the historic record unfortunately only goes back at best 30 days. However, there is a special site available (albeit intermittently) where data can be downloaded. When trying to download the full historic record for all measuring stations, the system returned errors. Furthermore, only data from the official stations can be downloaded online. Data for the citizen scientist devices have to be requested through e-mail. I have submitted a query and am hoping for a response, in order to get access to historic data.
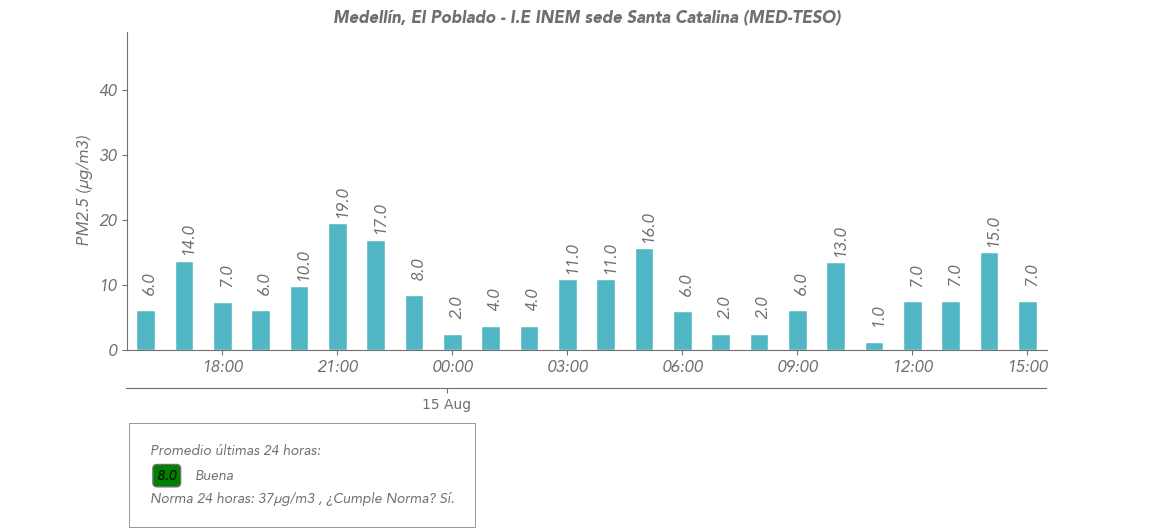
In the meantime, let's look at 24 hour graph for measuring station 84.

What I find interesting - and somewhat worrying - are the large fluctuations that can be seen here. Within the span of two hours, the concentration goes from 17 to 2 (from 22.00 till midnight). The next day, within a span of three hours the values jump from 6, to 13, and then to 1. I do not know enough about this topic to understand what this means. However, this illustrates the importance of better understanding how these devices work, the data reliability, and looking not just at averages but also at the standard deviation.
For now, I am preparing a list of questions that I think are important to try and answer, in order to be able to identify the most suitable areas from an air quality perspective.
- How do the annual mean and the 24-hour mean of each individual station compare with the WHO guidelines?
- How much fluctuation is there throughout the year? And what about changes due to pandemic lockdowns?
- Can any primary drivers of local air quality be identified from these data?
- Why are large fluctuations seen within a matter of hours in the data?
- How reliable are the official stations? How is this different for the cloud devices?
- Is air quality at ground or lower level similar to that at a higher level (e.g. on the 15th floor of a building)?
- Can something be said about the reach of each device? In other words, how quickly does air quality change and how big a "bubble" can we draw around a single device?
- Are spot-checks possible with an own device? Can data from such spot-checks somehow be used to compare the air quality in one area to the air quality in surrounding areas?
- What device could we get to do such measurements?
Some of these questions are Medellín-specific, whereas others relate to the broader topic of air quality measurement. I will be diving into this in the coming weeks, and I hope to learn some new things along the road. Stay tuned!
Back to overview
